Y-Compare/Match Help
YCompare displays the kits that match the one specified in either the Compare or Matches tools.
It lists all the Marker allele values and highlights any differences from the 1st (top) kit specified.
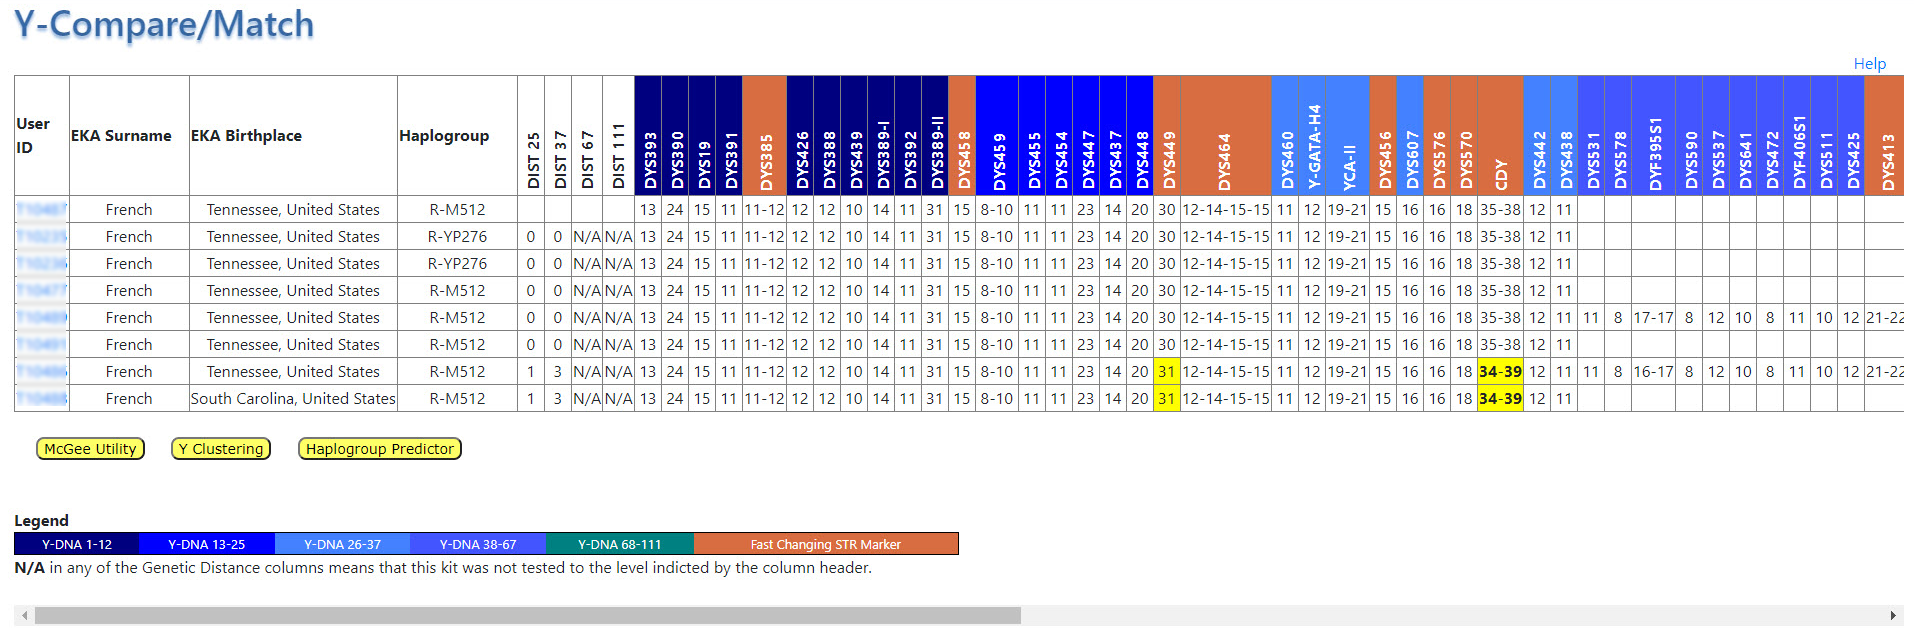
Columns:
- User ID - The Identification number given to the kit when created. Click on this link to see details for this kit.
- EKA Surname - Surname of the Earliest Known Ancestor (EKA) on the direct patralineal line (Y-DNA test)
- EKA Birthplace - EKA's place of birth
- Haplogroup - Haplogroup entered by user
- Genetic Distance (4)
- DIST 25
- DIST 37
- DIST 67
- DIST 111
- Marker Values - Short Tandem Repeat (STR) marker values (alelles) that represent your Haplotype (the set of DNA alelle values; not to be confused with Haplogroup). The figure above only shows part of the chart; it goes out to 111 markers. The color codes of the DYS headers reflects the range of markers tested by that kit.
| Color | Marker Range |
|---|---|
| 1-12 | |
| 13-25 | |
| 26-37 | |
| 38-67 | |
| 68-111 | |
| Fast Changing |
Match/Compare Tool Buttons
The Dean McGee Y-Utility allows you paste in Y-DNA allele data (a haplotype) from a Project (or other sources) and recieve 3 major reports;
1) FTDNA haplotype comparison, 2) Genetic Distance matrix chart and 3) TMRCA matrix chart.
This interface formats your mitoYDNA data into the correct format for this utility and puts it in the clipboard.
After you click the button and you are taken to the other website, paste your data into the box labeled 'Paste haplotype rows here'.
The are other options within Y-Utility that allow you to do network diagrams and phylogenetic relationships.
Y Clustering is one of many tools at Rob Spencer's Scaled Innovation website. This interface formats your mitoYDNA data into the correct format for this tool and puts it in the clipboard. After you click the button and you are taken to the other website, hit the 'Clear' button and paste your data into the box and then click 'Start the Analysis'.
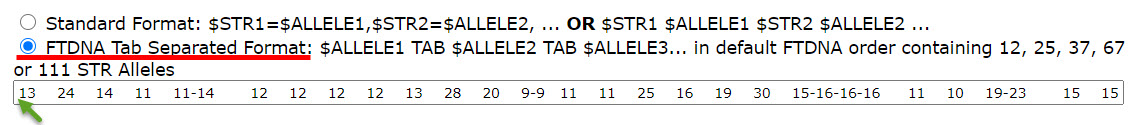
YSEQ has a Haplogroup Predictor tool.
This interface formats your mitoYDNA data into the correct format for this tool and puts it in the clipboard.
After you click this button you are taken to the other website, click the 'FTDNA' radio button and paste your data into the box below.
If your test is below 111 markers, it may appear that nothing was pasted but the end is just blanks. Press HOME and you will see the data.
Put your cursor in the box and press ENTER.
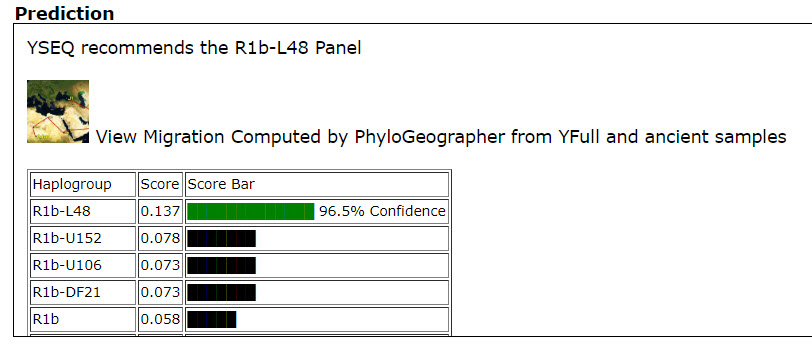
The screen will refresh and you can scroll down and see input used (STR Input) and the Prediction as a horizontal bar chart with the highest % at the top.
Currently, mitoYDNA only uses up to 67 markers (for which the YSEQ tool is designed).
Y-DNA Genetic Distance
When talking about two or more Y-Chromosome STR haplotypes, Genetic Distance (GD) is the total number of differences, or mutations, between two sets of results.
The lower the number, the closer you are related.
In general, it is found by summing the differences between each STR marker.
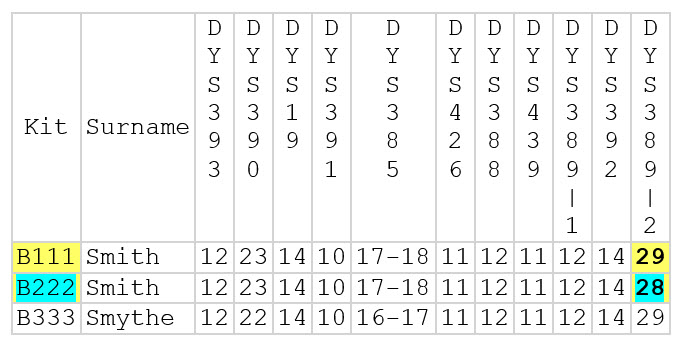
For example (see chart below), kit B111 and B222 have allele values of 29 and 28 respectively at DYS389-2. This is a difference of 1 {29-28= 1}. Because this is the only difference in their Y DNA12 haplotype, their genetic distance is 1.
It has nothing to do with Generations; just math!
In July 2017, FTDNA introduced changes in how the genetic distance is calculated for some multi-valued markers (eg., DYS385, DYS464). Roberta Estes has an excellent blog entry about this change here.